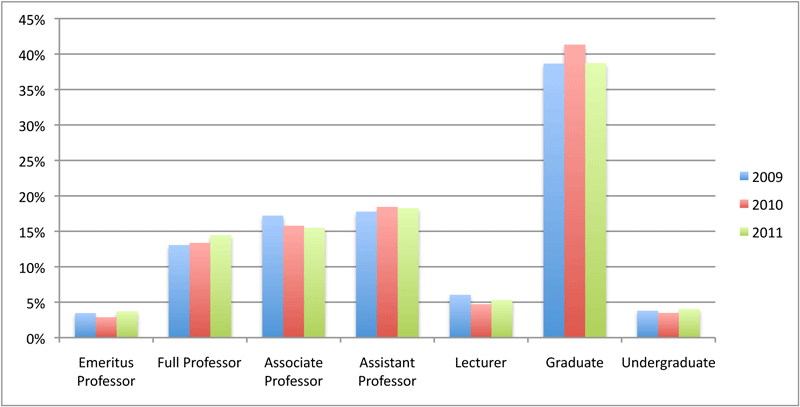
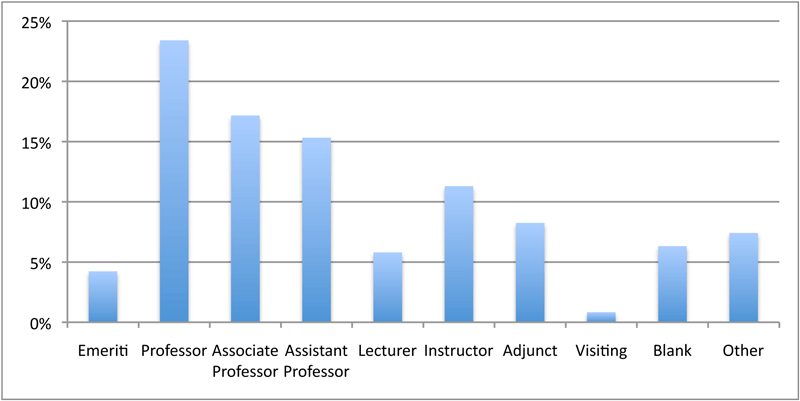
Rank across institutions
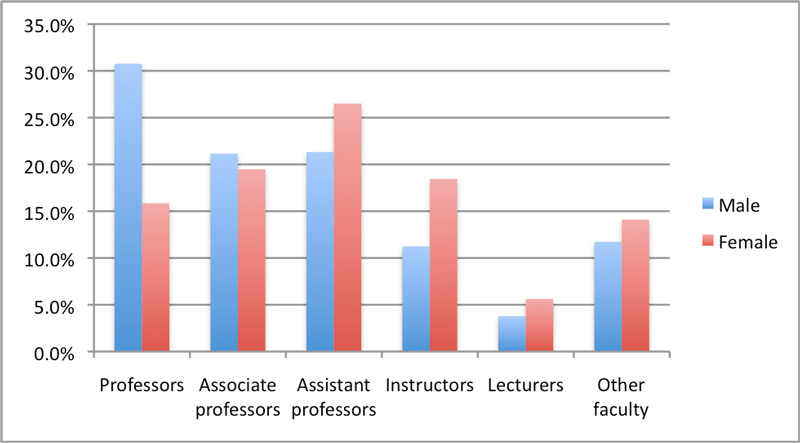
Rank: SMT vs. IPEDS
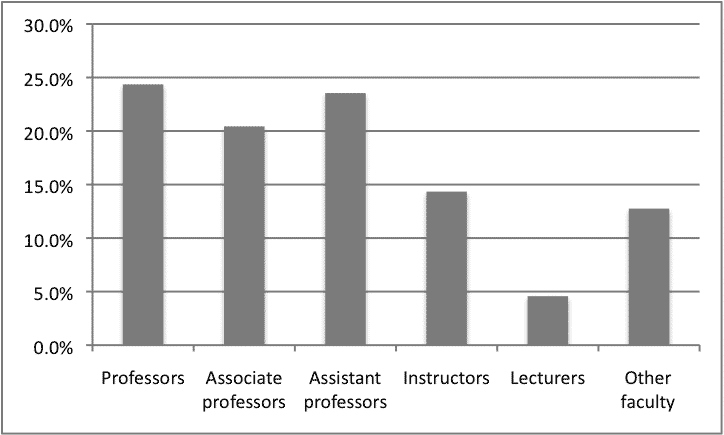
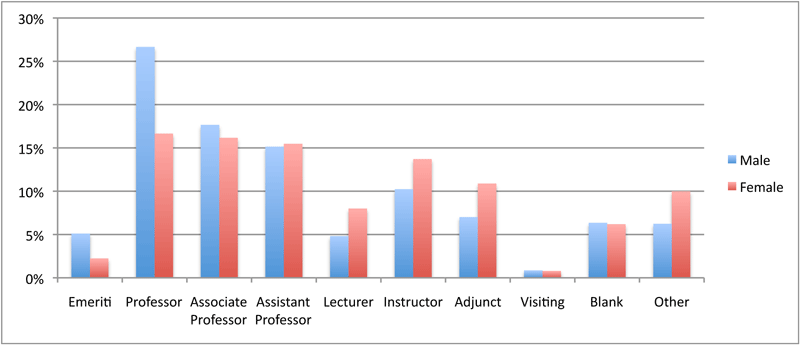
Rank: SMT vs. CMS
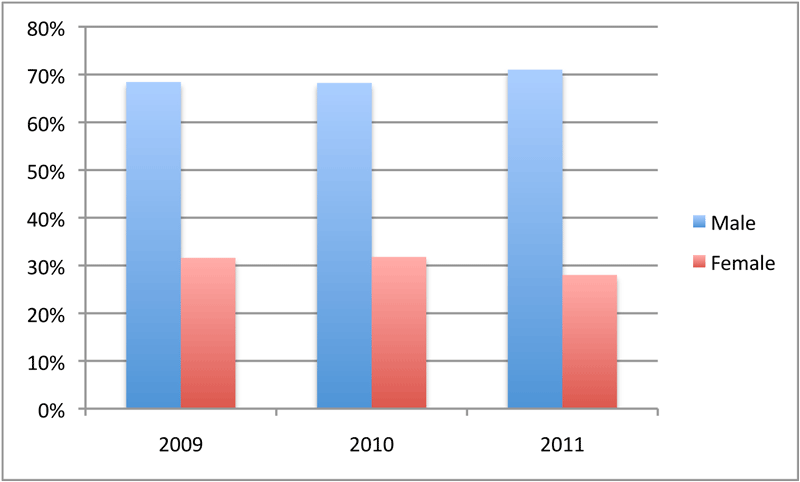
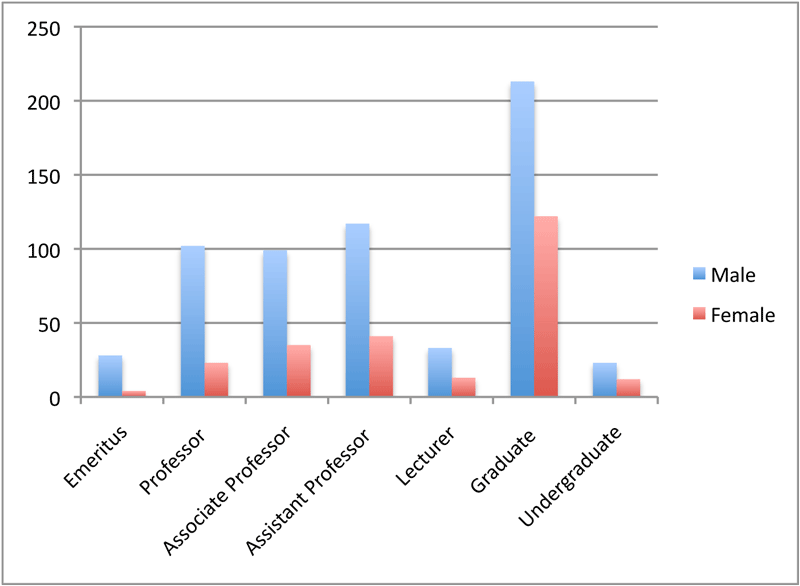
Gender
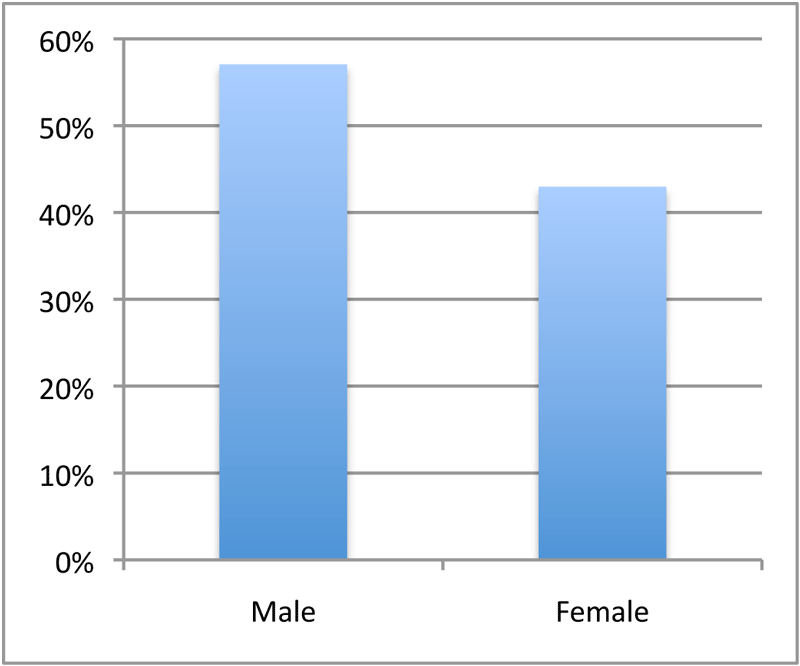
Gender: SMT vs. IPEDS
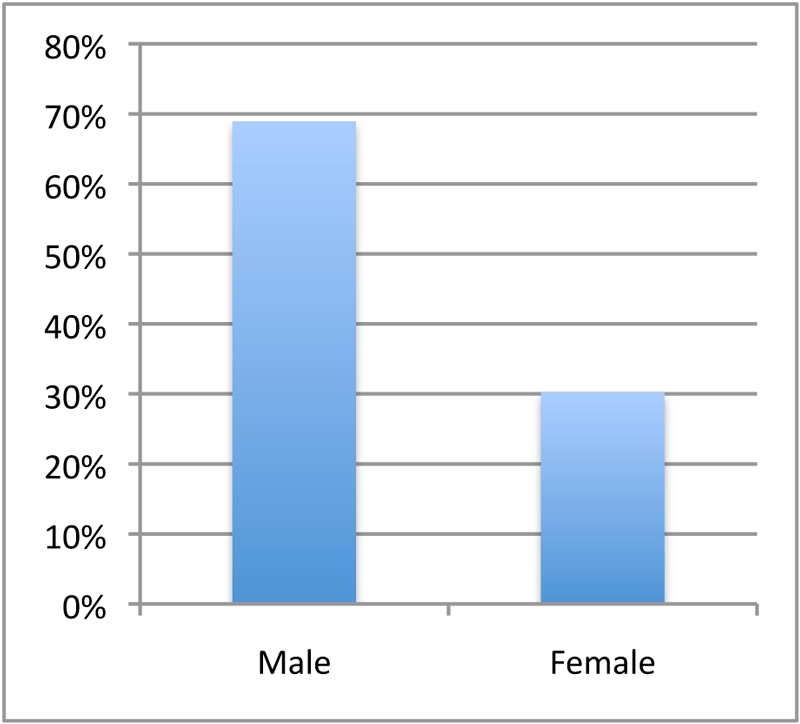
Gender: SMT vs. CMS
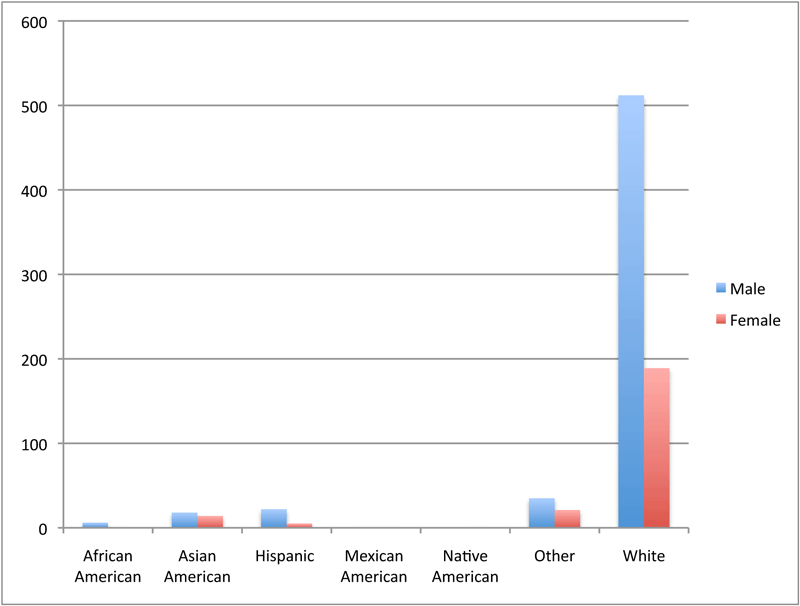
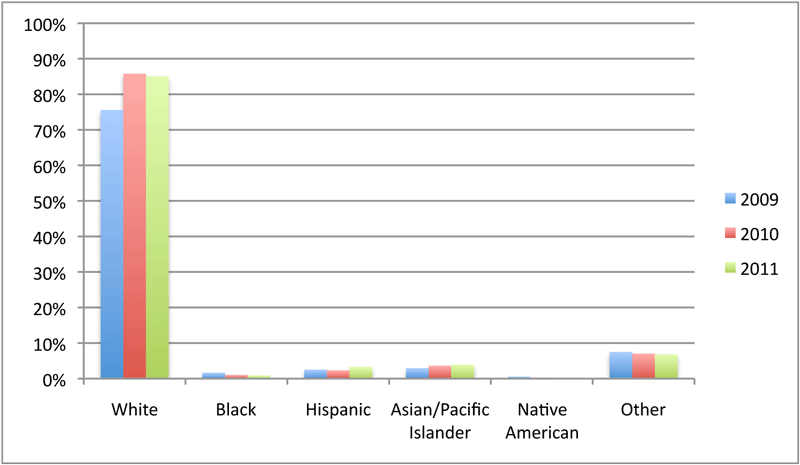
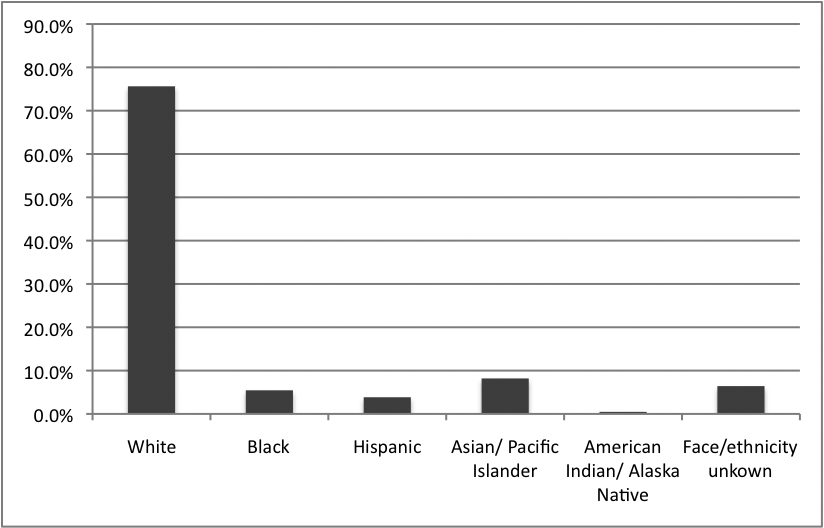
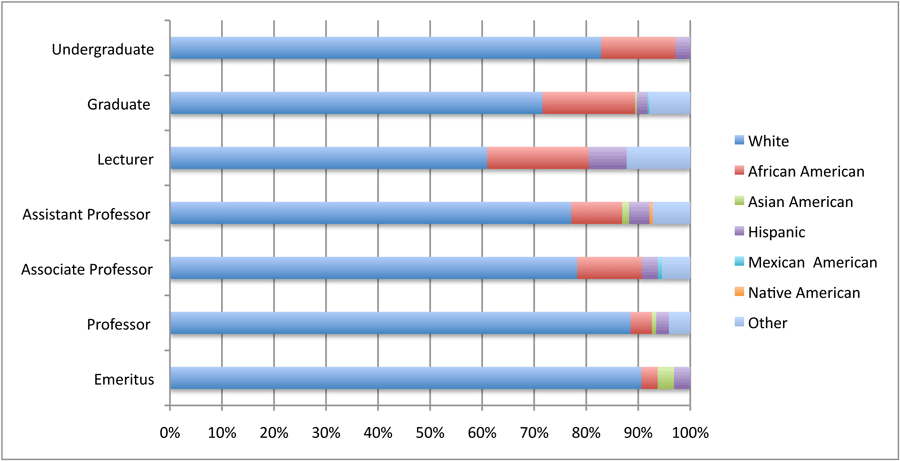
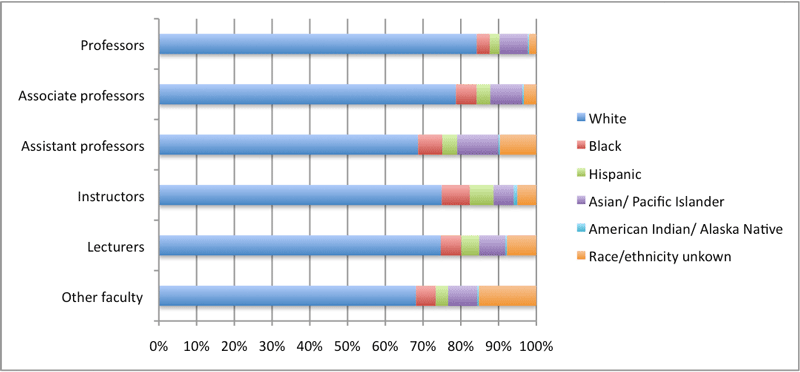
Ethnicity
Ethnicity: SMT vs. IPEDS
Collated data
Rank Collated with Gender
Rank Collated with Ethnicity
Gender Collated with Ethnicity