
Background
Former SMT president Justin London responded to these requests by establishing the Ad hoc Committee on Demographics and he gave us four charges. He wanted us to determine:
- what the overall breakdowns are on gender and ethnicity in higher education;
- what the more relevant breakdowns are for graduate students and faculty in the humanities;
- how many music theorists there are; and
- what our Society’s demographics are.
We have fulfilled the first two charges through data available from Integrated Post Secondary Education Data System (IPEDS), the third charge through data provided by the College Music Society (CMS), and the fourth charge through SMT’s own data. Below, you will find a snapshot of the data collected, for the purposes of easy apprehension and comparison.
Snapshot of demographic data
- Rank
-
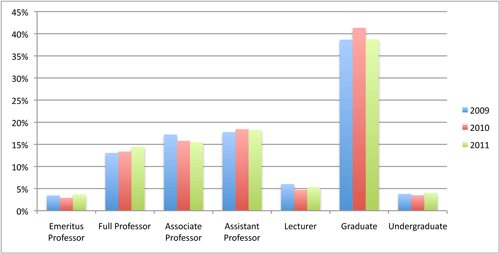
Graduate students comprise the largest group of the Society; assistant professors comprise the second largest group; emeritus professors comprise the smallest group. Percentages for each group have remained roughly equal from 2009-2011.
More comparison charts
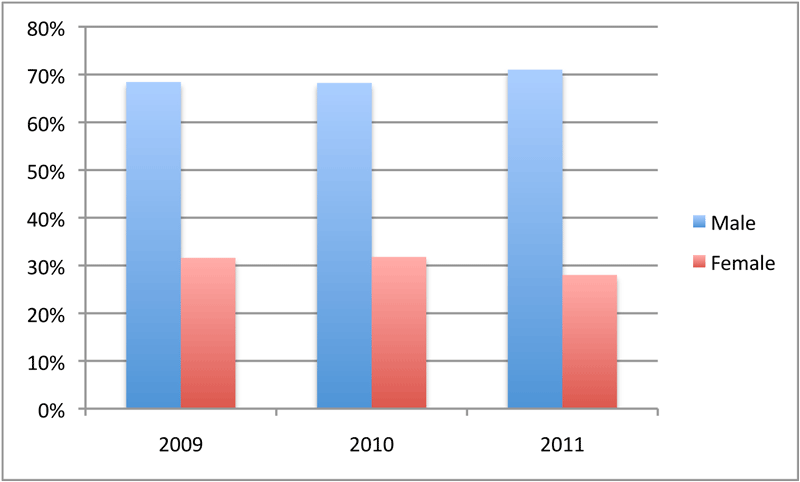
- Gender
-
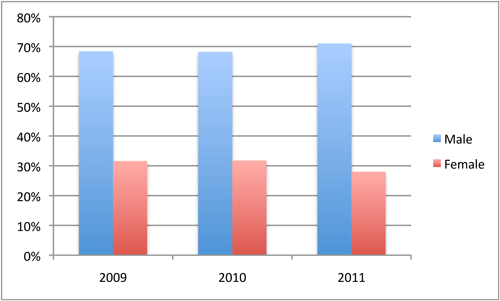
More than two thirds of the Society’s members are male while less than one third are female. While the relationship between the two categories remained nearly steady in 2009 and 2010, the percentage of male members increased in 2011.
More comparison charts
- Ethnicity
-
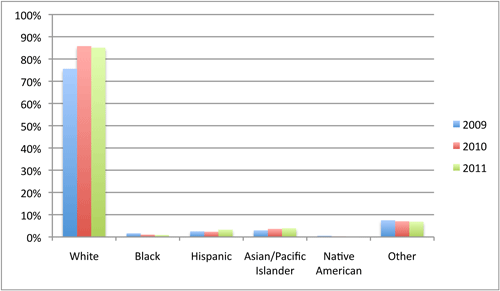
The white membership comprises the largest group of the Society; the “other” membership category comprises the second largest group; and the Native American membership comprises the smallest group. Except for the white group when comparing 2009 and 2010, the percentages for each group have remained roughly equal over a period of three years.
More comparison charts


About the data
SMT
From our own Society, we were able to obtain data only from 2009, 2010, and 2011 (no gender or ethnicity data is available from 2001–2008). The data collected by the Society includes rank, gender, ethnicity.
IPEDS
From the Integrated Post Secondary Education Data System, we were able to obtain a wealth of raw data for 2005, 2007, and 2009, including a breakdown of student rank by field according to Bachelor, Master’s, and doctoral levels.
CMS
From the College Music Society, we were able to obtain data only for 2011. CMS compiles data on gender and rank, but not ethnicity. There are some problems with the data. CMS relies on universities to update their own statistics every year, and the only way to sort the data is by identifying traditional theory teaching areas (theory, aural skills, composition), not by how individuals identify themselves. Music historians, for example, who teach one section of aural skills would still be counted as music theorists. As well, gender is not self-reported; rather, it has been determined by CMS staff according to “standard” gendered name usage, which might work for names like Jennifer but not for unisex names like Lee, Madison, or Darcy. The manner in which the data has been compiled and inputted by the CMS does not allow for sorting to yield straightforward, accurate results.
Complete data
Download IPEDS, SMT, and CMS data
This webpage was designed to accompany a short PDF report from the demographics committee. Access the 2013 committee's memo here.